Debugging Metasploit With Debug.gem
Plus a few extra tips for good measure :)
Introduction
Whilst poking around some of the Ruby news I noticed that Ruby didn't have any good debugger support. I'd always been curious why this is, given that we have tools such as WinDBG for Windows, gdb for Linux, and built-in IDEs with debugging capabilities for languages such as Java and C++, yet Ruby didn't seem to have any good tools for this sort of thing.
Some more poking around lead me to RubyMine which had a built-in debugger. Unfortunately, like others that I have spoken to, getting RubyMine's debugger to work with a project like Metasploit has been a hit-and-miss experience. Some people have been able to get it to work just fine, whilst others like myself have been left struggling to get it to connect properly or even properly recognize our local Ruby version managers.
So for a long time, the only real viable way for me to do things was to use Pry. Now Pry has its place, but let's be honest, do you really want to manually step through code with a view of only a few lines of code at a time, and then have to insert breakpoints by updating the code and then reloading things? At the very least this adds significant overhead to your workflow, and at worst it takes a long time to reload the application and get it back into a state when it can hit that breakpoint that you set again, only for you to then have to repeat that process when you need to add another breakpoint.
Lo and behold though, after a few years of doing things this way I happened to stumble into this video from RubyConf 2021 by Koichi Sasada:
So What is This Debug.gem Anyway?
If you haven't watched the video above, I'll give a TLDR summary here. Basically what happened is that the Ruby maintainers realized that Ruby didn't have any good debugging features and that the old method of debugging Ruby, using lib/debug, wasn't great as the lib/debug library had not been updated in some years.
There was also byebug, which is what Metasploit has historically used, and debase, also known as ruby-debug-ide, which is used by IDEs such as RubyMine and VSCode to allow IDE based debugging.
Unfortunately, all of these debuggers have some problems. Namely, they all slow down the execution of the program when adding breakpoints, some of them don't integrate well with IDEs or provide support for remote debugging, and some of them don't have support for new features such as Reactors within Ruby.
To solve these issues, debug.gem was created, which is a new debugger library for Ruby 2.6+ which aims to provide a better debugger experience for Ruby. It also aims to be efficient by making it so that adding breakpoints to a program does not slow down the execution of the program at all, whilst also providing support for remote debugging, IDE support, and support for newer features of Ruby.
If that wasn't enough though, the thing that makes this particularly interesting is that starting with Ruby 3.1, this Gem is bundled automatically with Ruby. This is significant to me because it indicates that not only is this going to be a new way of debugging Ruby, but it's also going to become the standard way that people will be expected to debug Ruby going forwards.
Performance Vs Other Debuggers
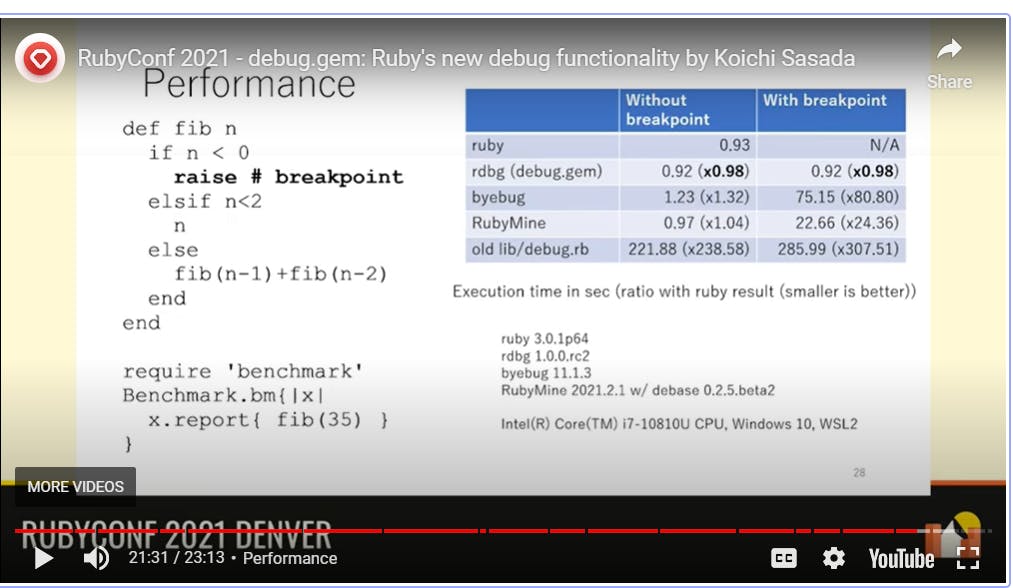
This is best explained by this slide from the presentation above:

Here we can see that native Ruby took 0.92 seconds to execute without a breakpoint, and with a breakpoint the same code with debug.gem took the same amount of time to execute. Compare this to byebug, which took nearly 80 times as long to run the same code with a breakpoint and 1.04 times as long without, or RubyMine's debugger, which took 24 times as long to run the same code with a breakpoint, yet achieved near-native runtime without breakpoints.
This can be quite important when running applications that require a lot of breakpoints to debug things or when testing applications that are sensitive to timings on when operations are performed, which gives debug.gem another advantage over its competitors.
Features of Debug.gem
I'd be remiss if I didn't talk about some of the cool features that debug.gem brings to the table though, so the following is a list of some of the cool things that you can do with debug.gem. You can find a more complete list over at https://github.com/ruby/debug:
Set breakpoints on a specific line of a file with
break <file>:<line>Set breakpoints on a specific name within a class with
break <class>#<name>Set scriptable breakpoints with
break <breakpoint location> pre: <command>to execute a debug command before the breakpoint is hit, orbreak <breakpoint location> do: <command>to execute a debug command when a breakpoint is hit and then continue execution.catch <Exception>to set a breakpoint whenever a certain exception is raised.watch @ivarto stop execution when the variable@ivarwithin the current scope is changed.whereamito show the current source code surrounding the line you are paused on within the debugger.editto open the current file the debugger is paused on within a code editor.infoto show the local/instance variables and defined constants within the current stack frame.frameto show the current stack frame, and thenupanddownto navigate up or down with the stack frame and navigate the code on a stack frame by stack frame basis.threadwill show all threads whilstthread <thread number>will cause the debugger to switch to the given thread.Tracing support with the
tracecommand and its subcommands.The ability to replay traces using
recordcommand to capture a recording and thenstep backto start the replay.
Note that most of the functionality will operate the same way that you are used to using it within Pry, so the usual stepping instructions, next instruction, etc will work as expected. You can even make it work the same as pry by adding in some binding.break statements in place of your usual binding.pry statements if you prefer using that way of debugging your code, as noted at https://github.com/ruby/debug#modify-source-code-with-bindingbreak-similar-to-bindingpry-or-bindingirb.
How To Install
Installation instructions for debug.gem can be found at https://github.com/ruby/debug#installation and depends on how you want to use it. For Metasploit we have already added this into the Gemfile.lock file so that Bundler can use it, which means you just have to run bundle install and it will work.
If you don't already have it in your Gemfile.lock file and you are using Bundler for your project, you can just add the line gem "debug", ">= 1.0.0" to your Gemfile.lock file.
Otherwise, just run gem install debug and you should be able to install things that way as well.
Setting up VSCode Integration
To set up VSCode Integration, you will need to install the vscode-rdbg extension from https://marketplace.visualstudio.com/items?itemName=KoichiSasada.vscode-rdbg. If you want to view the source code before installing, you can find the GitHub repo over at https://github.com/ruby/vscode-rdbg.
Once you have it installed you will need to quit VSCode and reopen it to reload the vscode-rdbg extension. From here, click File->Open Folder and navigate to the folder containing the project code you wish to debug. Once this code is open, click on Run->Add Configurations->Ruby (rdbg) and you should get a new .vscode/launch.json file that looks something similar to the following:
{
  // Use IntelliSense to learn about possible attributes.
  // Hover to view descriptions of existing attributes.
  // For more information, visit: https://go.microsoft.com/fwlink/?linkid=830387
  "version": "0.2.0",
  "configurations": [
    {
      "type": "rdbg",
      "name": "Debug current file with rdbg",
      "request": "launch",
      "script": "${file}",
      "args": [],
      "askParameters": true
    },
    {
      "type": "rdbg",
      "name": "Attach with rdbg",
      "request": "attach"
    }
  ]
}
This JSON file contains a version and some comments but we can safely ignore that. The part we are interested in is the configurations section. We can see there are two different sections, which are differentiated by their request type. The first one is launch, whilst the other is attach. Both of them have a type field corresponding to the type of program used to debug, and a name field which shows in some popup windows to describe what they do.
The first thing we will want to do for both examples is to append the line "localfs": true. This will tell debug.gem and more specifically its rdbg client that both the target and the debugger are on the same system. If this is not the case, then feel free to not add this line.
Next, we need to tell rdbg how to launch the program that we want to debug for the launch action type. For this, we have two fields, script, which is the path on the command line to the executable we want to run, and args, which is an array of the arguments we want to pass into this program when debugging it.
For Metasploit I set these options to "script": "${cwd}/msfconsole" to specify that we should be using the msfconsole script within the local directory, and I left the args option as is since msfconsole doesn't need any arguments to run.
The final part of the default config is the askParameters option. This controls whether, every time you debug the target, it will ask you to confirm the parameters you are using. I liked this when starting to use rdbg to confirm that what I was running was correct. However for everyday operations, this quickly gets to be nagging, so I set this to false in my setup.
I also had to set the debugPort option up so that VSCode knew where to find the debug connection. This can be done by doing "debugPort": "127.0.0.1:55634" .
If you are using bundler like I am to manage Gem dependencies, be sure to also add in "useBundler": true, to your configuration file.
Finally, and this is quite important, with the introduction of IRB 1.6 and debug.gem's associated update, there was a shift to using the same Debug terminal within VSCode to show the output and to do debugging. This works fine for applications that run in the background and which don't need user input. However, if you do need to send command line input locally, then you will need to now use "useTerminal": true within the launch.json file so that the plugin will use separate VSCode terminals for the debug output and for the STDIN/STDOUT of the program. Without this, you will get a very confusing mess if you are trying to run a terminal-based program locally. Note that this will supposedly slightly slow the program's execution down, but I haven't noticed any issues in my testing.
The final copy of my file looks like this:
{
  // Use IntelliSense to learn about possible attributes.
  // Hover to view descriptions of existing attributes.
  // For more information, visit: https://go.microsoft.com/fwlink/?linkid=830387
  "version": "0.2.0",
  "configurations": [
      {
          "type": "rdbg",
          "name": "Debug current file with rdbg",
          "request": "launch",
          "script": "${cwd}/msfconsole",
          "args": [],
          "useTerminal": true,
          "askParameters": false,
          "localfs": true,
          "useBundler": true,
          "debugPort": "127.0.0.1:55634"
      },
      {
          "type": "rdbg",
          "name": "Attach with rdbg",
          "request": "attach",
          "localfs": true
      }
  ]
}
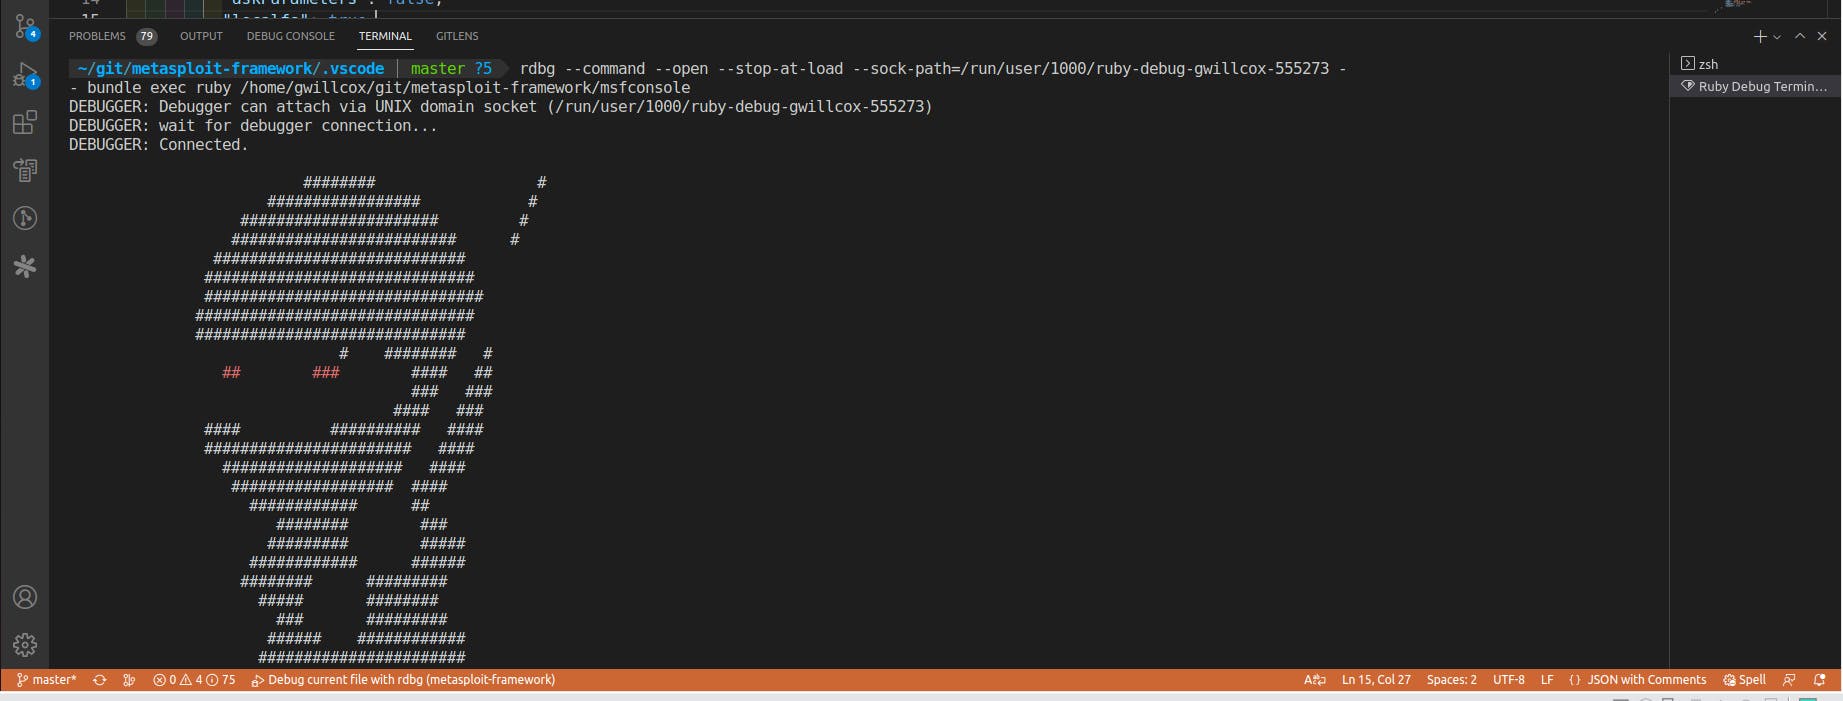
Now you should be able to debug your program using Run->Start Debugging. If everything went well, the bottom of the VSCode window should turn orange to indicate that the connection between rdbg and VSCode has been made. If at any point this color goes away, you know the connection has been lost. It should remain a steady orange if everything is going well with this connection.
Once connected you should see output similar to the following. Note the DEBUGGER: Connected. part of the output indicating a successful connection, as well as the orange lower part of the screen indicating an ongoing debugging connection.

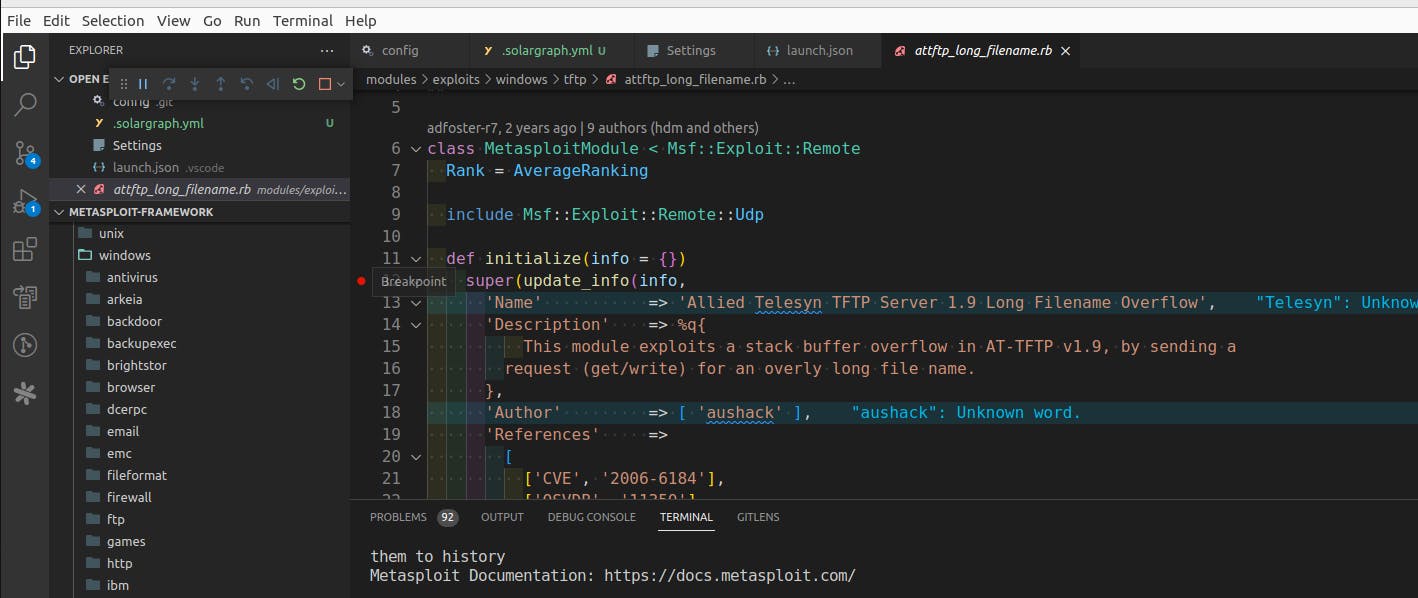
From here you should now be able to open up a file and place breakpoints like so:

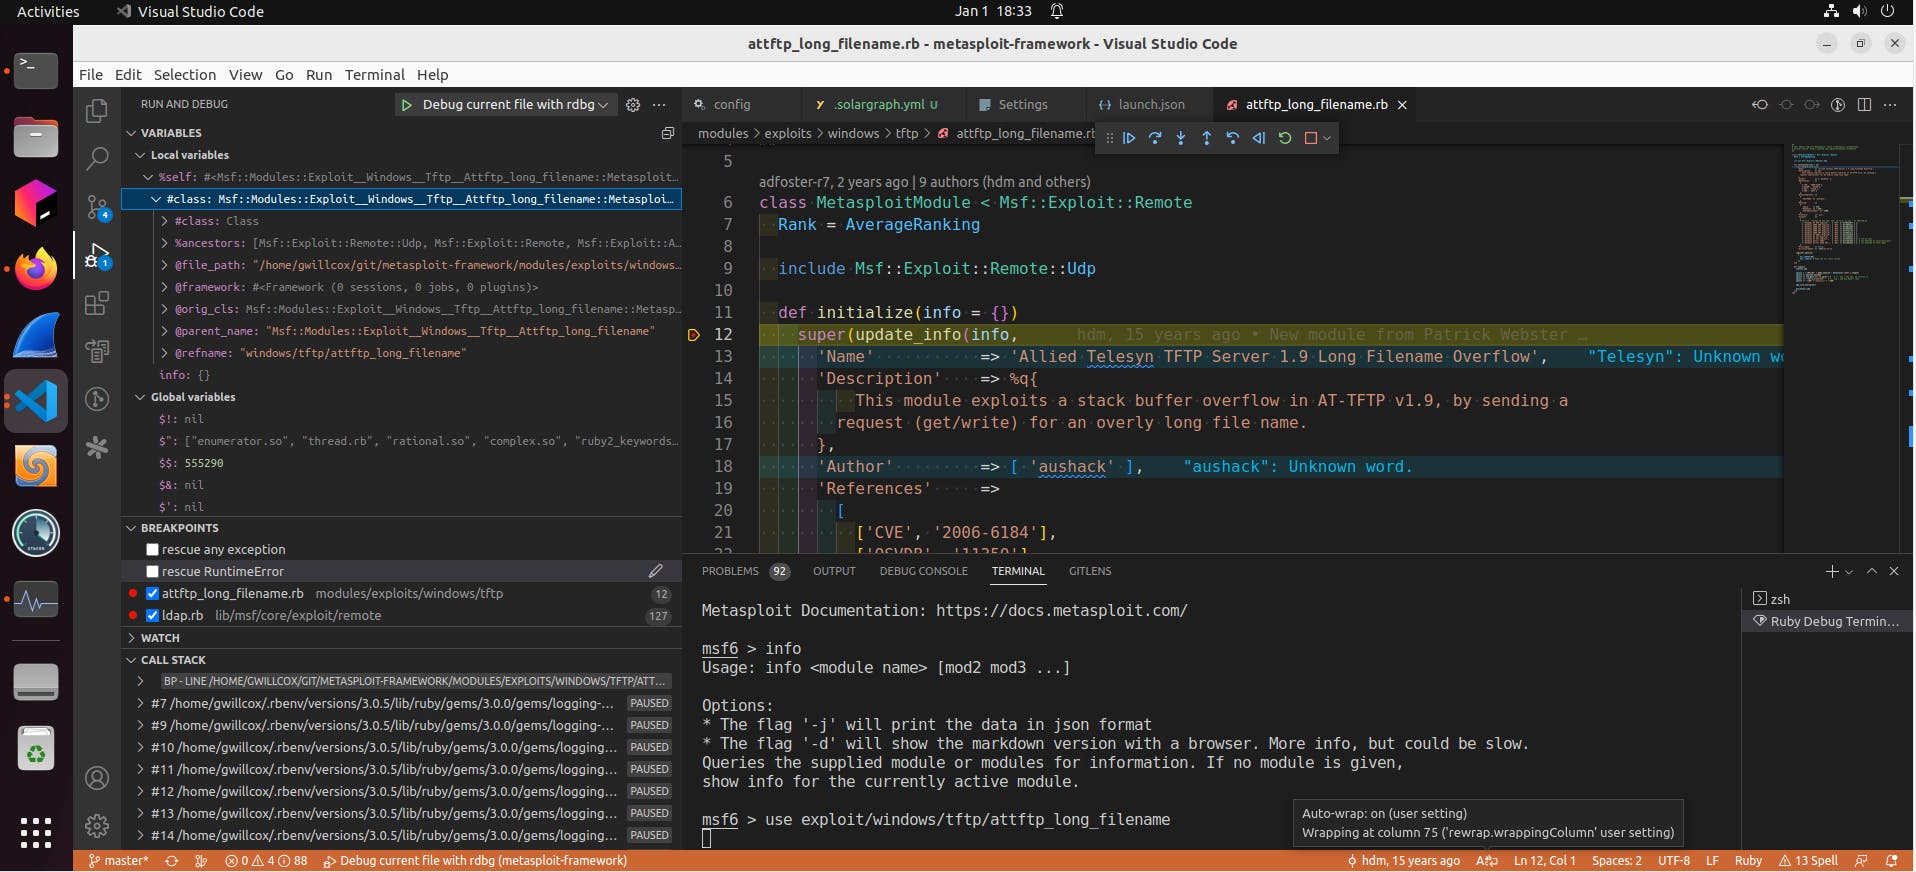
Now let's see how this works if we load up the module in question, aka exploit/windows/tftp/attftp_long_filename into msfconsole:

As you can see we get a nice hit on our breakpoint with a yellow highlight line to show us where the debugger currently is within our code. We can also see a list of local variables and inspect them further over on the left side of the screen in VSCode's Debug view, and we can see our list of breakpoints there as well. Additionally, in the same Debug view, we can also see the call stack.
From here we can use the debug control panel, which is located at the top middle of the screenshot above, to start stepping through the code.
Setting up RubyMine Integration
Unfortunately, I am unaware of any way to get debug.gem to work with RubyMine at this time. This is because debug.gem relies on the Debug Adapter Protocol (DAP) from Microsoft, whose specs are at https://microsoft.github.io/debug-adapter-protocol/, which allows developers to develop against one debug protocol and then have integration with any IDE that supports the DAP protocol.
Additionally, there is also the Language Server Protocol (LSP) from https://microsoft.github.io/language-server-protocol/ which is used to allow programs such as Solargraph's language server to provide additional insights into code to any IDE that supports the LSP protocol.
Both of these protocols are not supported by RubyMine at this time. For LSP support see https://intellij-support.jetbrains.com/hc/en-us/community/posts/360001627960-IntelliJ-support-for-Language-Server-Protocol-as-a-client- which indicates that IntelliJ based IDEs such as RubyMine are expected to recompile their plugins into a native plugin to get such support. Whilst there is some movement with this with the new Fleet program, there is still the issue that Fleet is early access and does not have support for many languages at this time.
As for DAP support, the post at https://intellij-support.jetbrains.com/hc/en-us/community/posts/360004975119-PHPStorm-and-Visual-Studio-Code-Debug-Adapter-Protocol was pretty to the point and noted that there will likely never be any support for DAP.
Naturally, my next thought was to see if there was some way to perhaps use the socket feature of rdbg, the client of debug.gem, to get connections working at the very least. Unfortunately at least 2022.3 of RubyMine, it seems you are locked into using the ruby-debug-ide interface and associated command line client, with no way to edit these settings.
I'm hoping RubyMine's developers decide to change their minds on this and introduce some level of compatibility with debug.gem but given their decisions in these areas, it seems unlikely that this will be happening anytime soon. The best bet might be some integration with their new product Fleet, but this would also mean that all of the RubyMine-specific features that make it the product that it is wouldn't be supported.
Conclusion
Hopefully, this has helped to explain some of the history and logic behind the debug.gem in a shortened version and explain why it has advantages over existing solutions. As development continues on debug.gem I'm sure there will be even more use cases to explore and even more optimizations and improvements that will be made.
If you have any questions or concerns, feel free to leave them down below. I'm hoping to do some more in-depth tutorials on some of the advanced features of debug.gem such as the tracing feature, and I'd be curious to know if there are any features that you haven't quite wrapped your head around that you'd like more explanation on.